As the demand for AI continues to grow, so does its environmental impact.Training, fine tuning, and even serving your models, especially generative models can be compute intensive and energy-intensive, but it doesn't have to be carbon intensive. You can do things like query the breakdown of energy sources for different regional electricity grids across the world using the Electricity Maps API. This can give you the context to customize where and when you run your ML jobs in the cloud. Specifically, you can choose low CO2 energy sources to power your training jobs by running them in data centres to powered by low-carbon energy sources such as wind, solar, hydro, or nuclear. If the balance between cost, latency and other factors make sense when you consider the carbon footprint, you may as well be aware that we can make a difference by choosing a different cloud region.
It's easier to understand our environmental impact when we use a single-use plastic fork, water bottle, fly on a plane, or put gas in a car. However, it's harder to grasp the impact of cloud computing and machine learning, where we're just writing code.
Current estimates suggest that computing accounts for around 2.5 to 3.7% of global greenhouse gas emissions, more than the commercial airline industry. And AI workloads are continuing to grow.
I'd like to thank Nikita Namjoshi for her videos on the topic on coursera, as well as, from Google Cloud, John Abel, Cynthia Wu, Khulan Davaajav, and Jeff Sternberg. From DeepLearning.AI, Eddy Shyu.
Carbon Emissions in Computing
First, we need to understand the energy and electric grid's impact on computing infrastructure and carbon emissions. The machine learning (ML) lifecycle has a carbon footprint, including hardware production and compute energy use. Emissions from hardware (CPUs, GPUs, TPUs, servers) production include extracting raw materials, manufacturing, and shipping. This is known as embodied carbon, referring to all the emissions produced in the supply chain for a given item or product. These emissions are usually the most difficult to estimate in the ML lifecycle because supply chains are complicated.
Emissions from compute are more straightforward to calculate, encompassing training and inference energy use, i.e., compute emissions for powering and cooling servers. Training and serving ML models require significant energy, and the energy usage varies by training strategy, hardware, and data centre efficiency. Carbon emissions can be substantial, with significant variability based on multiple factors. For example, Strubell et al. 1 found that training a transformer model with neural architecture search, a technique for automating the design of neural networks, was comparable to the carbon emissions of five cars over their useful lifetime. However, a paper from researchers at Google 2 showed that training the same transformer model was closer to 0.00004 car emissions. Some researchers estimated 3 that the energy consumption for a full training run of a 6 billion parameter transformer model was 103,593 kWh, roughly the energy used by 100 average US households in a year. The large discrepancy highlights how factors like training strategy, hardware, data centre efficiency, and location can massively impact carbon emissions.
The Electric Grid
Energy is produced by power plants. These power plants could be sourcing energy from carbon-emitting fossil fuels like coal or gas or non-carbon-emitting sources like wind or solar. This energy then flows through a network of transmission lines and substations, known as the electric grid, to power our homes, offices, restaurants, hospitals, and data centres. The mix of carbon and non-carbon-emitting sources of energy is different for each regional grid. For example, France relies heavily on nuclear, Sweden on hydro, and Texas on natural gas. Carbon intensity also fluctuates throughout the day due to renewable energy availability.
You can explore the carbon intensity of regions worldwide with Electricity Maps. There you can explore the climate impact of electricity for many countries globally.
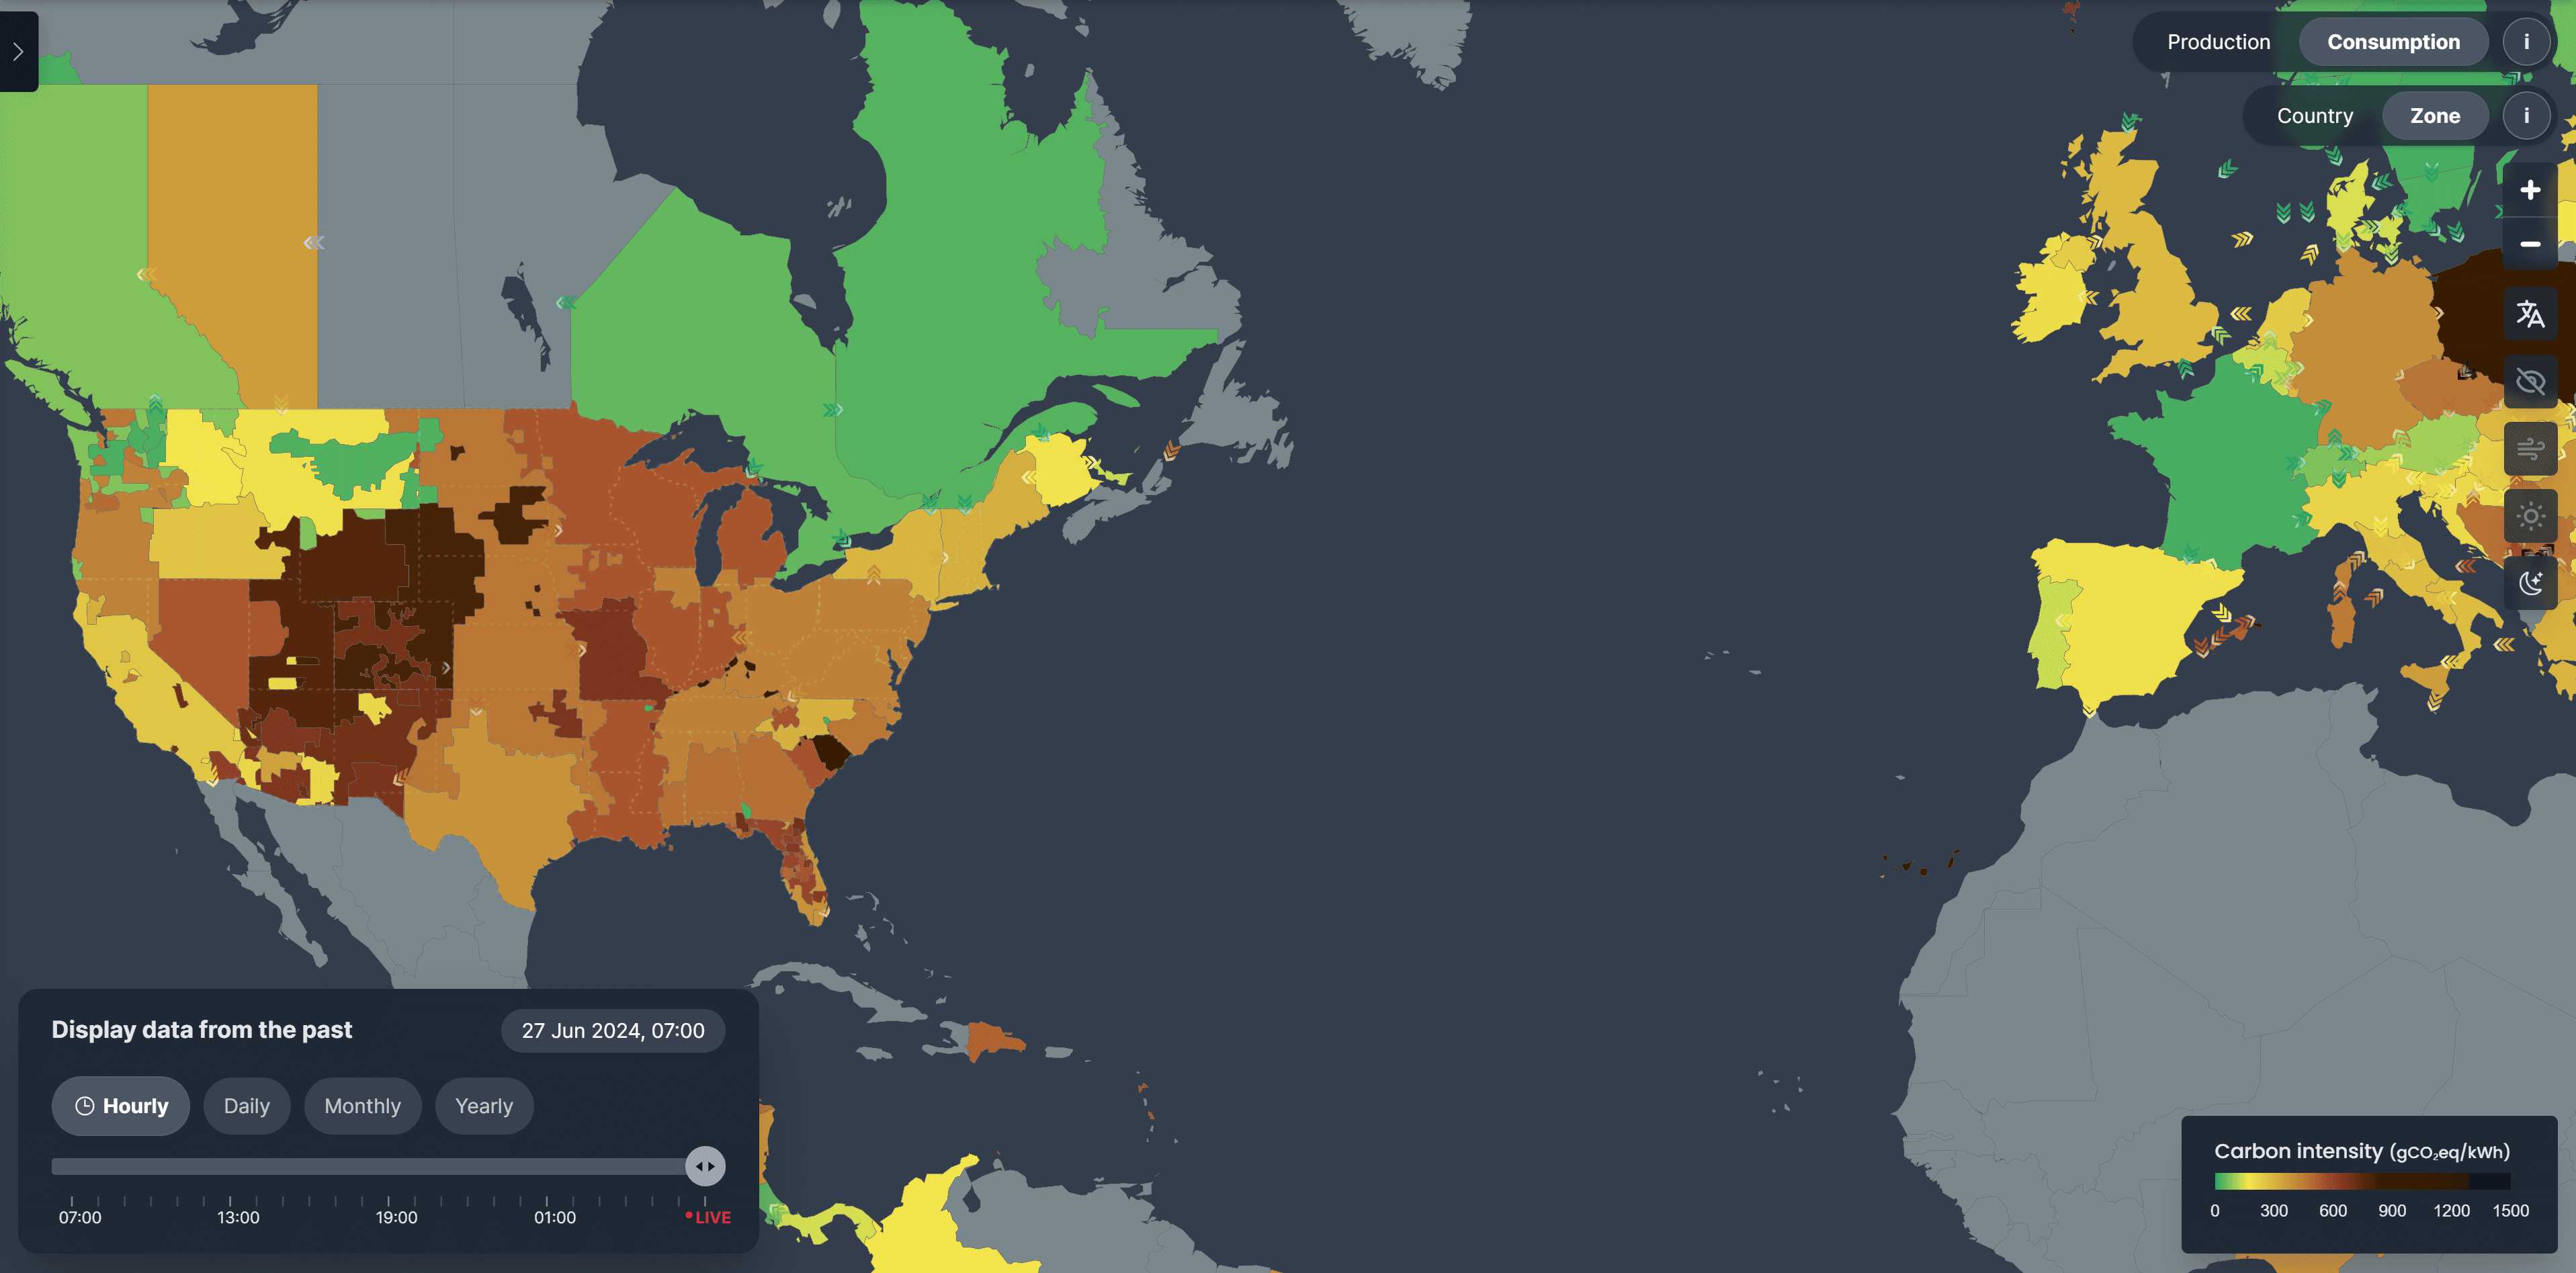
They provide data quantifying how carbon-intensive electricity is on an hourly basis across over 50 countries, and they have an API to get real-time energy data about the grid.
Estimating Carbon Emissions of Compute
Grams of CO2 equivalent (CO2eq) is a measure used to compare emissions from various greenhouse gases based on their global warming potential by converting amounts of other gases, like methane, to the equivalent amount of carbon dioxide with the same global warming potential. For example, 1 ton of CH4 has the same warming effect as about 84 tons of CO2 over 20 years, so we normalize this to 84 tons CO2eq.
We then measure carbon intensity using grams of CO2 per kilowatt-hour (measure of energy, not time). This can be obtained from Electricity Maps. We multiply this by energy consumption in kilowatt-hours for training jobs to estimate carbon emissions for that job.
We can measure the energy consumption for training in kilowatt-hours by multiplying the training time by the number of processors (usually GPU or TPU for ML) by the average power per processor. We can also include data centre overhead, like cooling systems, using the power usage effectiveness (PUE) metric. PUE measures data centre compute efficiency, calculated by taking the total energy used in the data centre divided by the energy used for computing.
Another to quantify the amount of compute required is GPU years, or the amount of time that it would take a single GPU type to run a job. For example, GPT-3 would take 405 V100 years to train in 2020.
Inference Energy Use
Inference also consumes energy, impacting carbon emissions. For example, stable-diffusion-xl-base-1.0 generates 1594g CO2 per 1000 inferences 4, roughly the equivalent of four miles driven by an average gasoline-powered car.
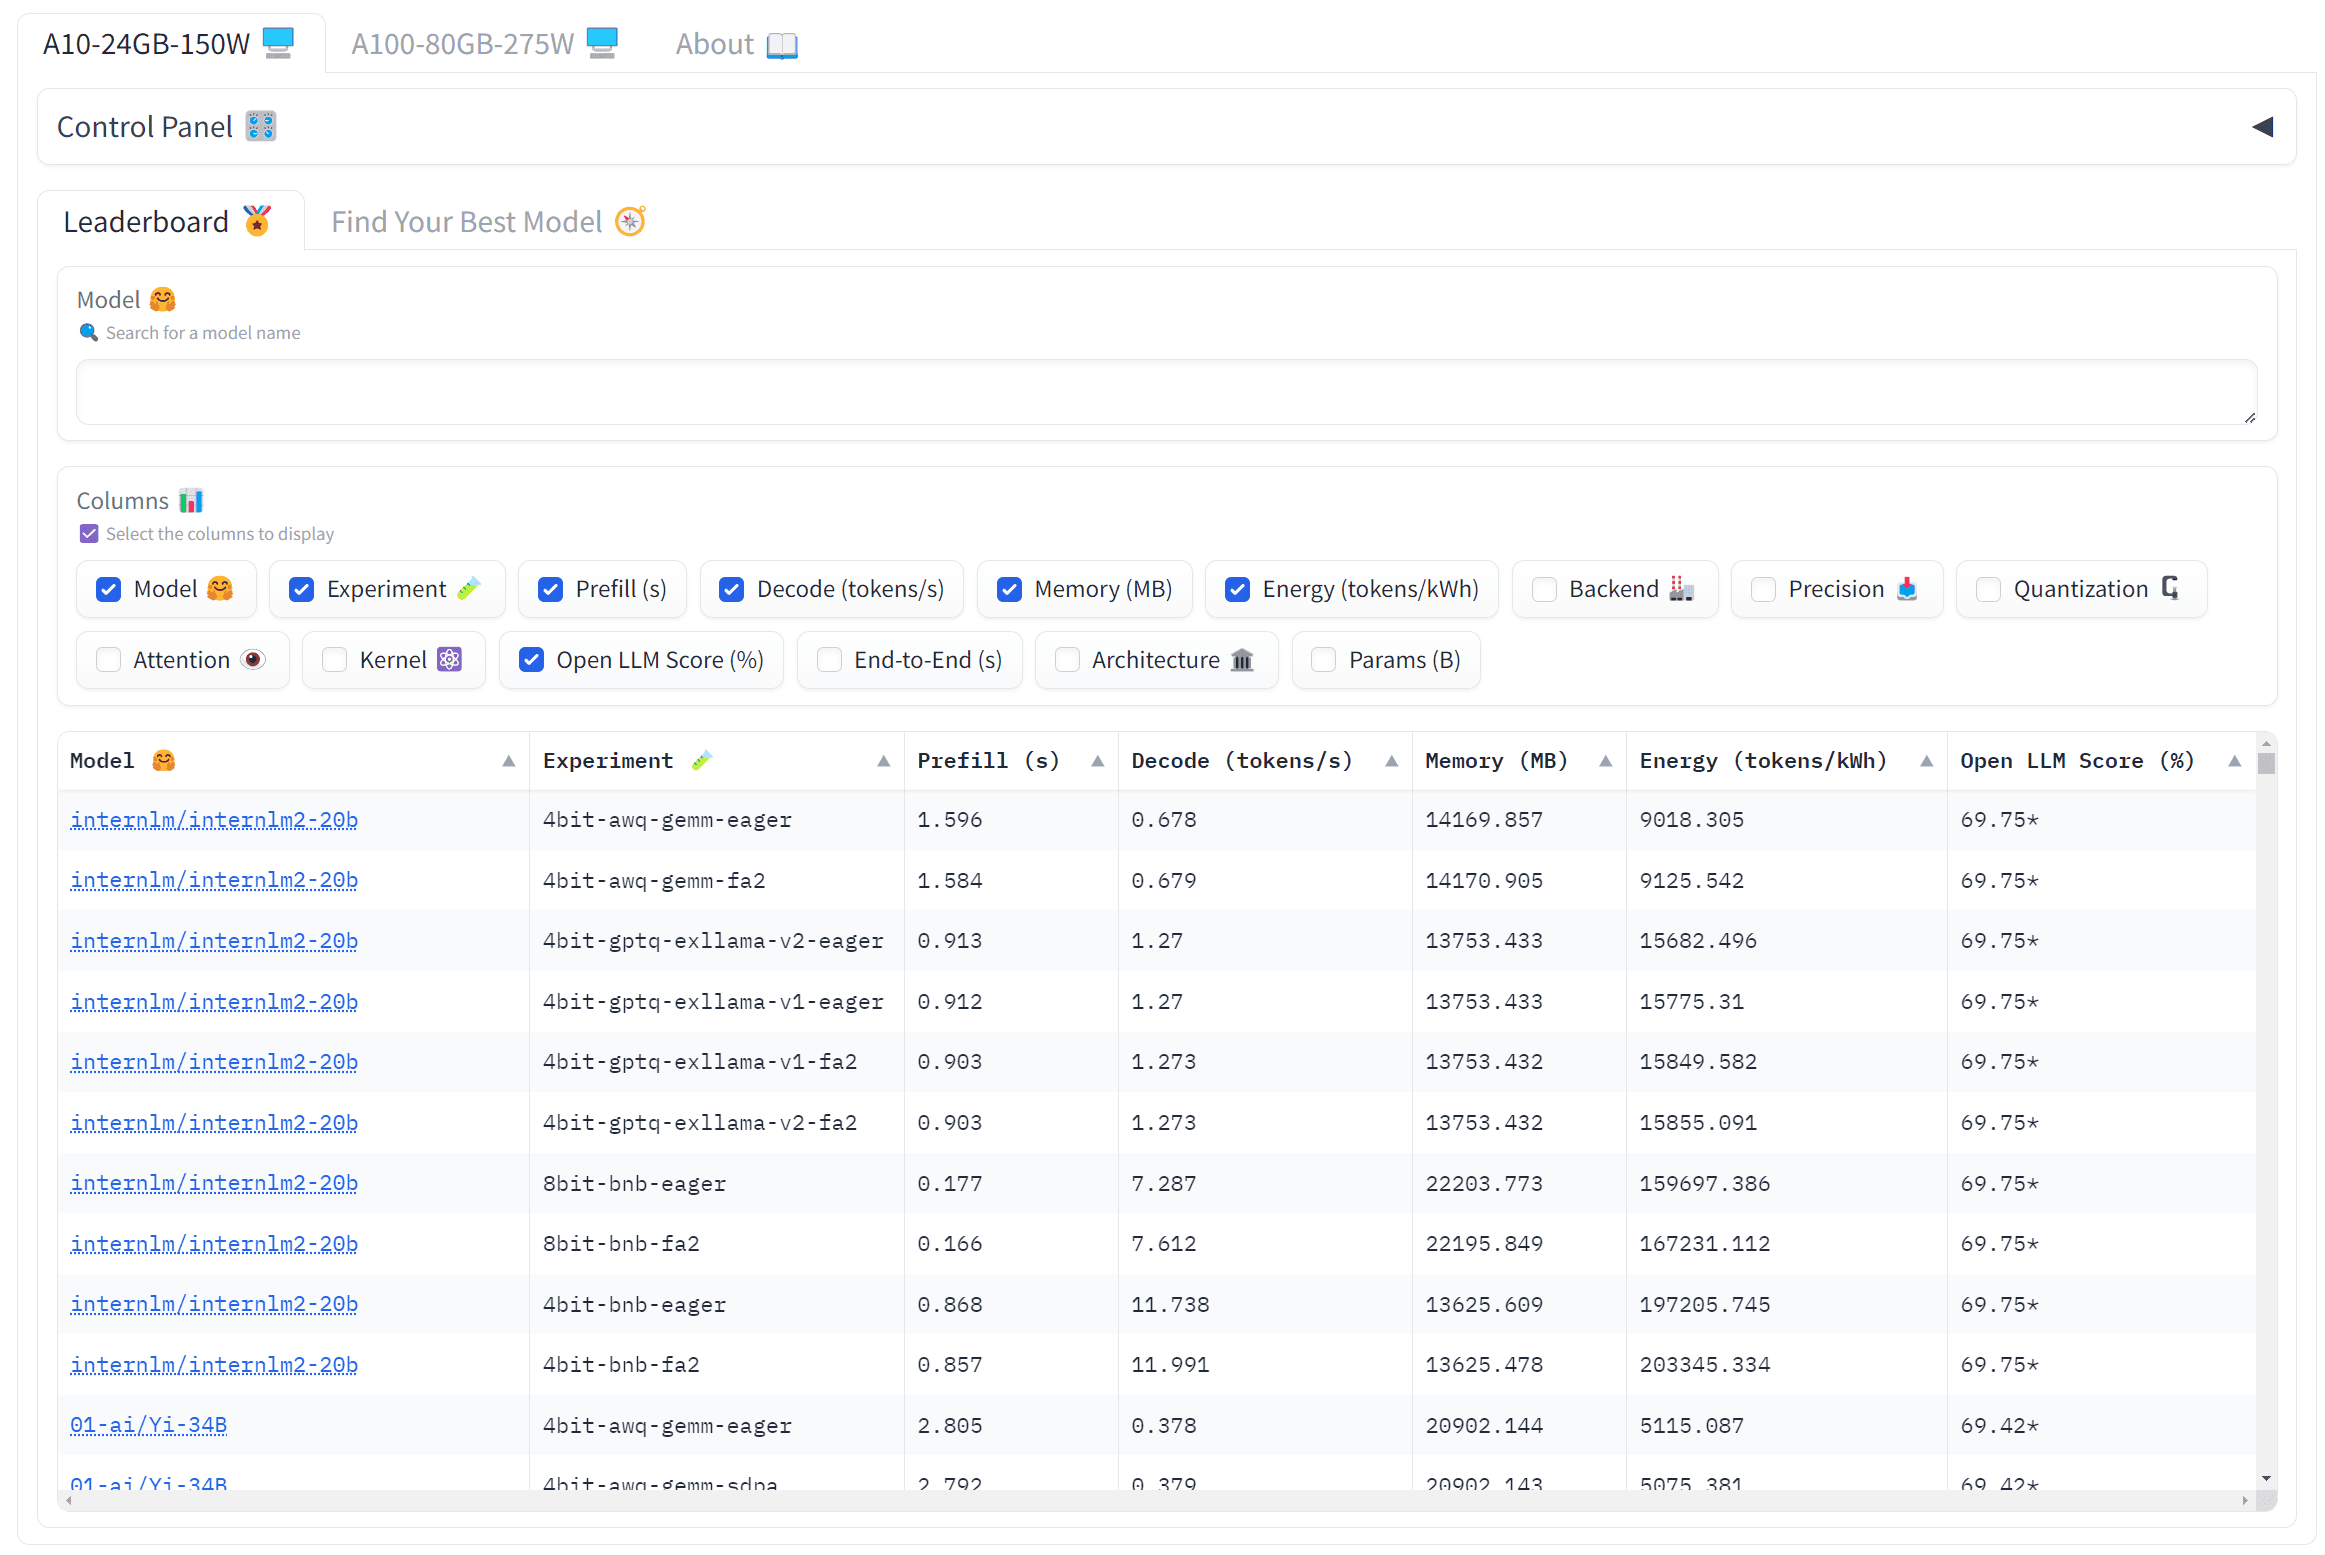
HuggingFace LLM Performance Leaderboard and ML energy leaderboard provide energy estimates and tokens per kilowatt-hours for models. These are good sites if we want to make model energy consumption part of the selection criteria. There is a pretty large range in energy requirements for inference:
Strategies for Carbon-Aware Development
In general, there are several strategies to reduce the carbon footprint of ML workloads:
- Choosing an energy-efficient model for inference.
- Training models in regions with low carbon intensity.
- Follow the sun and wind: Run flexible workloads at times of the day when there's more carbon-free energy available.
- Pick a cloud provider with a low PUE.
- Pick efficient hardware optimized for ML, like TPUs or newer GPUs.
- Focus on smaller, specialized models rather than training large models from scratch. Or fine-tune a pre-trained model.
At the end of it all, you can use tools like Google's Carbon Footprint Insights to understand your realized carbon footprint. This tool provides insights into the carbon footprint of your cloud usage by project, helping you understand the environmental impact of your cloud services and make more sustainable choices.
Training AI Models in Low-Carbon Regions
One of the benefits of training models in the cloud is the flexibility to choose where the training occurs. If you're in a region with a high-carbon-intensity grid, you have limited control over the electricity source. However, by using the cloud, you can run compute workloads in regions with lower carbon grids, opting for areas with more carbon-free energy available. This allows for more environmentally friendly model training.
For example, Google provides average carbon intensity values for each of its data centre regions. You can also make your own real-time functions to return the region with the live lowest carbon intensity value for each region from the Electricity Maps API to help you decide where to host your compute:
def live_power_stats(lat,lon, api_key):
    coordinates = { "lat": lat, "lon": lon }

    url_intensity = f"https://api.electricitymap.org/v3/carbon-intensity/latest?lat={coordinates['lat']}&lon={coordinates['lon']}"
    request_intensity = requests.get(url_intensity, headers={"auth-token": api_key})
    intensity = json.loads(request_intensity.content)

    url_breakdown = f"https://api.electricitymap.org/v3/power-breakdown/latest?lat={coordinates['lat']}&lon={coordinates['lon']}"
    request_breakdown = requests.get(url_breakdown, headers={"auth-token": api_key})
    breakdown = json.loads(request_breakdown.content)

    breakdown_abridged = {
        'renewablePercentage': breakdown['renewablePercentage'],
        'fossilFreePercentage': breakdown['fossilFreePercentage'],
        'powerConsumptionBreakdown': breakdown['powerConsumptionBreakdown'],
        'consumption_percent': {
            k: np.round((v/breakdown['powerConsumptionTotal']) * 100)
            for k, v
            in breakdown['powerConsumptionBreakdown'].items()
        },
    }

    return intensity, breakdown_abridged
Other Selection Criteria & Caveats
Selecting a region just on emissions isn't feasible; you will need to account for latency, cost, services and features, compliance, etc. Use the AWS Regional Services Lists to check if the regions have the services and features you need to run your workload. Once you have a shortlist, you can choose regions near Amazon renewable energy projects or regions where the grid has a lower published carbon intensity. AWS has an entire guide on how to select a region for a workload based on sustainability goals worth reading.
Google Cloud also has a Region Picker, a tool to help select a region based on these other factors, including where traffic is coming from and products available.

One caveat worth mentioning here is that, based on the GHG Protocol, there are actually two methods to track emissions from electricity production: market-based and location-based. With the market-based method, emissions are calculated based on the electricity that businesses have chosen to purchase. For example, the business could decide to contract and purchase electricity produced by renewable energy sources like solar and wind. For these types of centres, the location based method of fetching via API does not make sense, and you will have to rely on the provider's published data.
AWS aims to power operations with 100% renewable energy by 2025. As a result, they have several regions listed that are powered by more than 95% renewable energy on the Amazon sustainability website. In 2022, the electricity consumed in 19 AWS regions was attributable to 100% renewable energy. For these cases, using local carbon intensity data from Electricity Maps API would not be an accurate estimate.
The state of Carbon-Aware AI
There is a lot of research being actively done in this space. For example, a family of language models called generalist language model (GLaM). The largest GLaM model with 1.2 trillion parameters consumes only a third of the energy used to train GPT-3 and requires half of the computation flops for inference, all while achieving comparable performance across 29 NLP tasks 5.
While we had focused on the footprint of training models, recent research has examined energy consumption during inference. Luccioni et al. highlight that, although a single inference requires much less computation than training, inference occurs far more frequently. For instance, with ChatGPT, even a single query per user could make the inference energy cost surpass training costs within weeks or months.
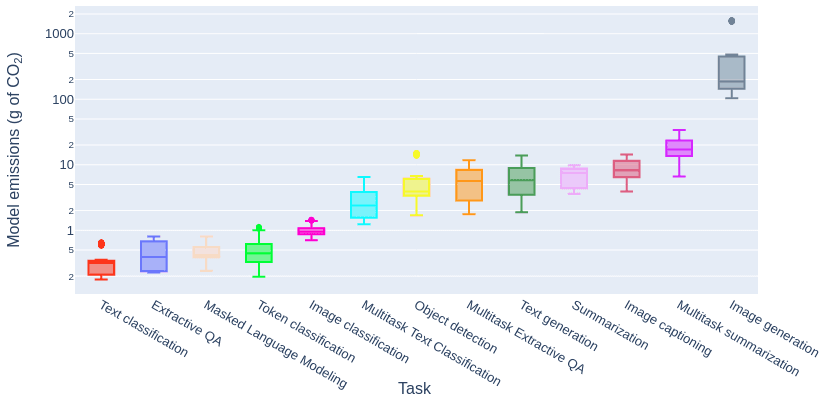
The study analysed 88 models across ten tasks and 30 datasets, covering natural language and computer vision applications. It examined the impact of modality, model size, architecture, and learning paradigm on energy efficiency. The paper found that tasks like summarization are more energy and carbon-intensive than classification, and image generation is much more energy-intensive than image classification or text generation.
Beyond carbon emissions, there's also a water footprint associated with generative AI. Data centres running GPUs and TPUs generate significant heat, requiring cooling systems that may evaporate a considerable amount of water. Recent efforts 6 have aimed to understand and quantify this water usage.
Footnotes
-
Emma Strubell, Ananya Ganesh, Andrew McCallum: “Energy and Policy Considerations for Deep Learning in NLP”, 2019 ↩
-
David Patterson, Joseph Gonzalez, Urs Hölzle, Quoc Le, Chen Liang, Lluis-Miquel Munguia, Daniel Rothchild, David So, Maud Texier, Jeff Dean: “The Carbon Footprint of Machine Learning Training Will Plateau, Then Shrink”, 2022 ↩
-
Jesse Dodge, Taylor Prewitt, Remi Tachet Des Combes, Erika Odmark, Roy Schwartz, Emma Strubell, Alexandra Sasha Luccioni, Noah A. Smith, Nicole DeCario, Will Buchanan: “Measuring the Carbon Intensity of AI in Cloud Instances”, 2022 ↩
-
Alexandra Sasha Luccioni, Yacine Jernite, Emma Strubell: “Power Hungry Processing: Watts Driving the Cost of AI Deployment?”, 2023, ACM Conference on Fairness, Accountability, and Transparency (ACM FAccT '24), June 3--6, 2024, Rio de Janeiro, Brazil ↩
-
Nan Du, Yanping Huang, Andrew M. Dai, Simon Tong, Dmitry Lepikhin, Yuanzhong Xu, Maxim Krikun, Yanqi Zhou, Adams Wei Yu, Orhan Firat, Barret Zoph, Liam Fedus, Maarten Bosma, Zongwei Zhou, Tao Wang, Yu Emma Wang, Kellie Webster, Marie Pellat, Kevin Robinson, Kathleen Meier-Hellstern, Toju Duke, Lucas Dixon, Kun Zhang, Quoc V Le, Yonghui Wu, Zhifeng Chen, Claire Cui: “GLaM: Efficient Scaling of Language Models with Mixture-of-Experts”, 2021 ↩
-
Pengfei Li, Jianyi Yang, Mohammad A. Islam, Shaolei Ren: “Making AI Less "Thirsty": Uncovering and Addressing the Secret Water Footprint of AI Models”, 2023 ↩